Zeek Logging Role
Installs and configures Zeek Network Security Monitor on Debian 12 using Docker containers. It's specifically designed for Ludus ranges to provide network traffic monitoring and analysis capabilities with optional Elastic Stack integration.
Overview
Zeek (formerly Bro) is a powerful network analysis framework that provides comprehensive network monitoring, security analysis, and traffic logging. This role deploys Zeek in a Docker container with JSON logging enabled for seamless integration with Elastic Stack.
Features
- Docker-based Zeek deployment using official Zeek Docker images
- JSON logging enabled for Elastic Stack integration
- Host network mode for comprehensive packet capture
- Privileged container with NET_ADMIN and NET_RAW capabilities
- Persistent log storage with volume mounting
- Automatic container restart policy
- Minimal configuration optimized for Ludus environments
Requirements
- Operating System: Debian 12 (Bookworm)
- Privileges: Root/sudo access
- Network: Internet connectivity for Docker image downloads
- Resources: Minimum 4GB RAM, 4 CPUs recommended
- Dependencies: Docker and docker-compose (automatically installed)
Role Variables
# Zeek installation directory
ludus_zeek_dir: "/opt/zeek"

# Zeek logs directory
ludus_zeek_logs: "/opt/zeek/logs"

# Zeek Docker image version
ludus_zeek_version: "8.0"
Proxmox Bridge Configuration
For optimal packet capture in Ludus environments, you need to configure the Proxmox bridge to operate in "hub" mode by disabling MAC address aging. If you are on a hosted Ludus setup without SSH access, open a ticket by emailing support@ludus.cloud to have bridge aging disabled for the users you specify.
Step 1: Identify Your Bridge Interface
# Check your range status to identify the second octet
ludus range status --user <username>
Step 2: Enable Hub Mode
# Disable MAC address aging (where XX is your second octet)
brctl setageing vmbrXXXX 0

# Example: If your second octet is 03
brctl setageing vmbr1003 0
Important: This configuration allows the Zeek sensor to capture all traffic on the bridge by preventing the switch from learning MAC addresses, effectively turning it into a hub.
Installation and Usage
Adding the Role to Ludus
# Add the private role to your Ludus environment
ludus ansible subscription-roles install -n ludus_zeek_logging --user <username>
Basic Range Configuration
Add the following VM configuration to your Ludus range:
- vm_name: "{{ range_id }}-ZEEK"
  hostname: "{{ range_id }}-ZEEK"
  template: debian-12-x64-server-template
  vlan: 10
  ip_last_octet: 50
  ram_gb: 8
  cpus: 4
  linux: true
  roles:
    - ludus_zeek_logging
With Elastic Stack Integration
For complete traffic monitoring with Elastic Stack integration:
- vm_name: "{{ range_id }}-ZEEK"
  hostname: "{{ range_id }}-ZEEK"
  template: debian-12-x64-server-template
  vlan: 10
  ip_last_octet: 50
  ram_gb: 8
  cpus: 4
  linux: true
  roles:
    - badsectorlabs.ludus_elastic_agent
    - ludus_zeek_logging
  role_vars:
    ludus_elastic_password: "elasticpassword"
Elastic Stack Integration
Prerequisites
First, add the Elastic Stack components to your range:
# Add required Elastic roles
ludus ansible roles add badsectorlabs.ludus_elastic_container --user <username>
ludus ansible roles add badsectorlabs.ludus_elastic_agent --user <username>
Elastic Server Configuration
Add an Elastic server to your range:
- vm_name: "{{ range_id }}-elastic-server"
  hostname: "{{ range_id }}-elastic-server"
  template: debian-12-x64-server-template
  vlan: 10
  ip_last_octet: 100
  ram_gb: 8
  cpus: 4
  linux: true
  testing:
    snapshot: false
    block_internet: false
  roles:
    - badsectorlabs.ludus_elastic_container
  role_vars:
    ludus_elastic_password: "elasticpassword"
    ludus_elastic_stack_version: "9.0.1"
    ludus_elastic_container_branch: bf9ebca3fa15f8dd814e4d5baa56ead9fa73590f
Configuring Zeek Integration in Kibana
-
Access Kibana: Navigate to your Elastic server via browser using credentials
elastic:elasticpassword -
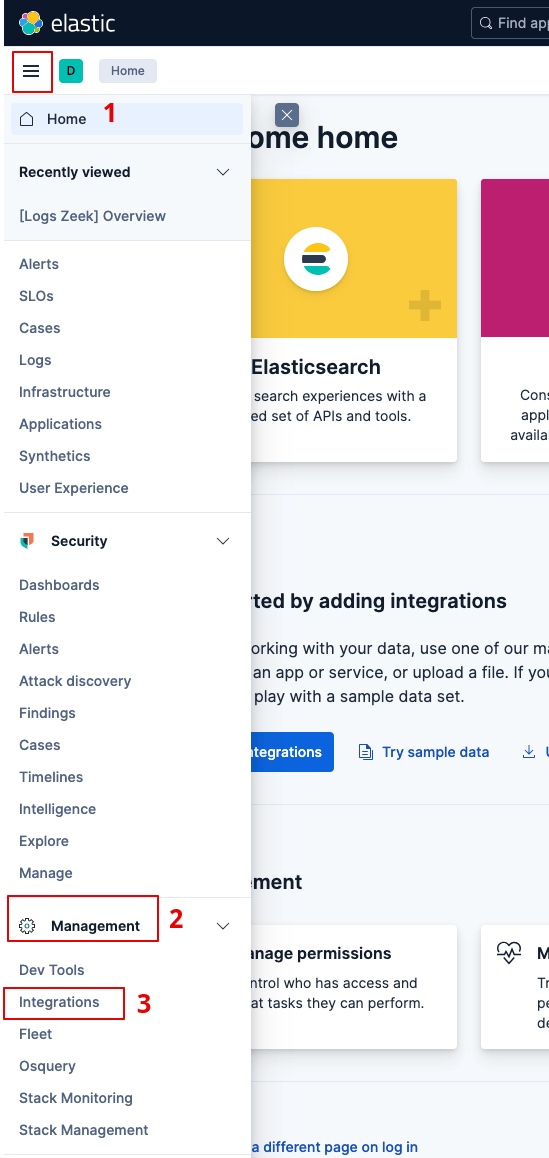
Navigate to Integrations: Go to Management → Integrations
-
Search for Zeek: In the Integrations page, search for "Zeek"
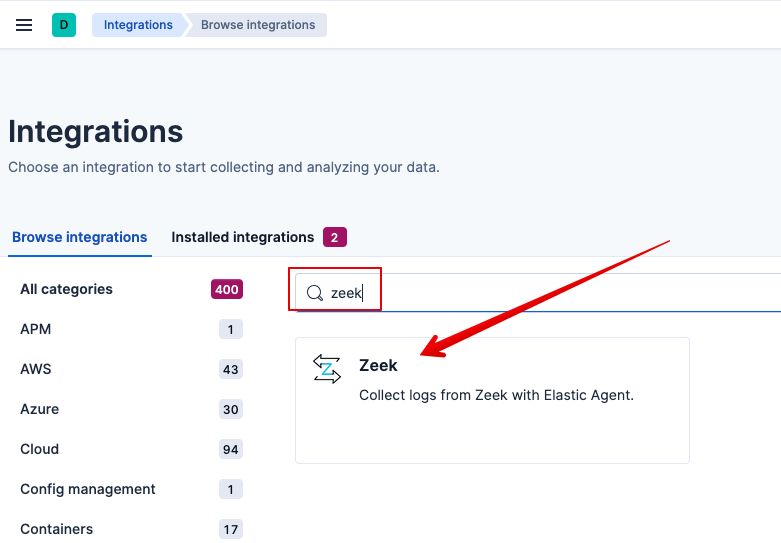
-
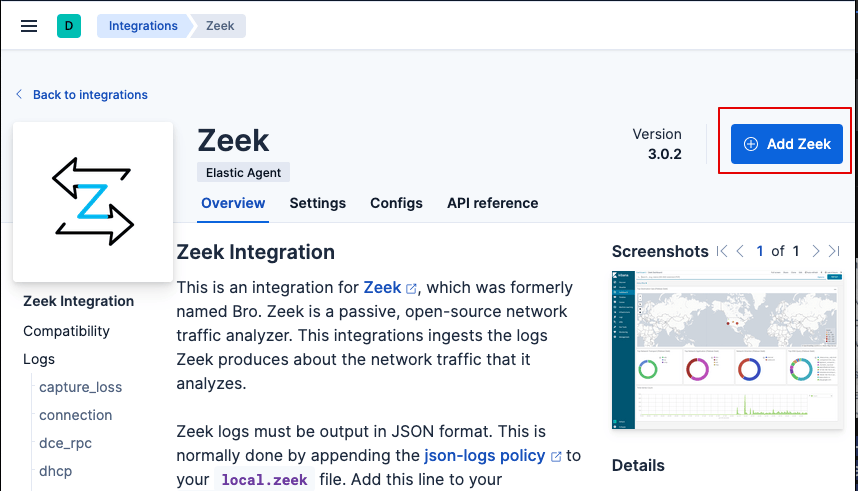
Add Zeek Integration: Click on "Add Zeek"
-
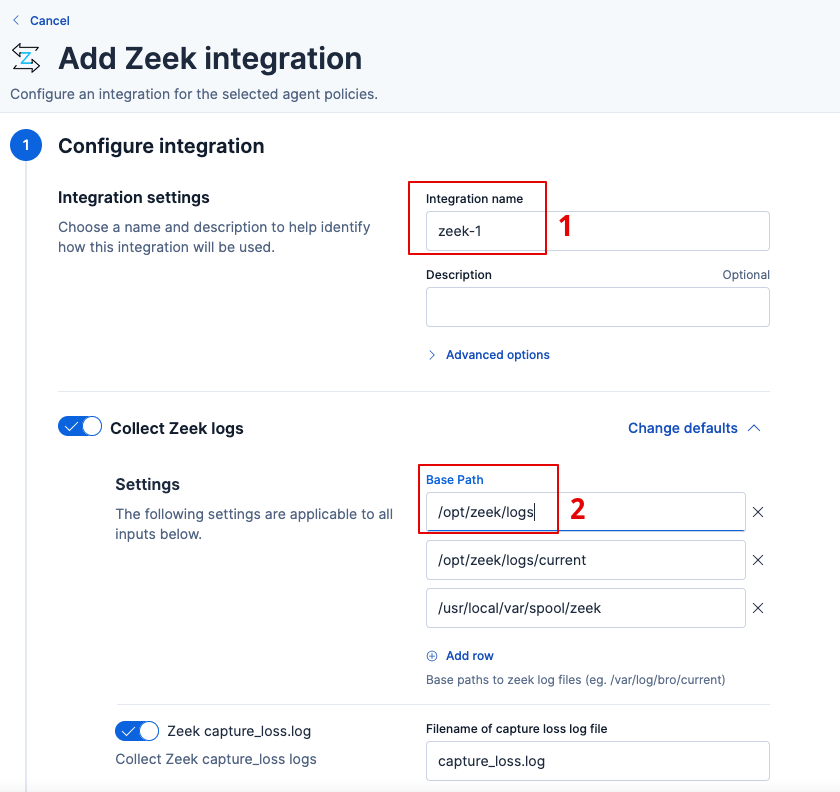
Configure Integration Settings:
- Change the Integration name if desired
- IMPORTANT: Set the "Collect Zeek Logs" base path to
/opt/zeek/logs
-
Assign to Agents: Select "Ludus Agents" for the policy assignment, this allow the elastic agent on the Zeek VM to send logs to the Elastic server
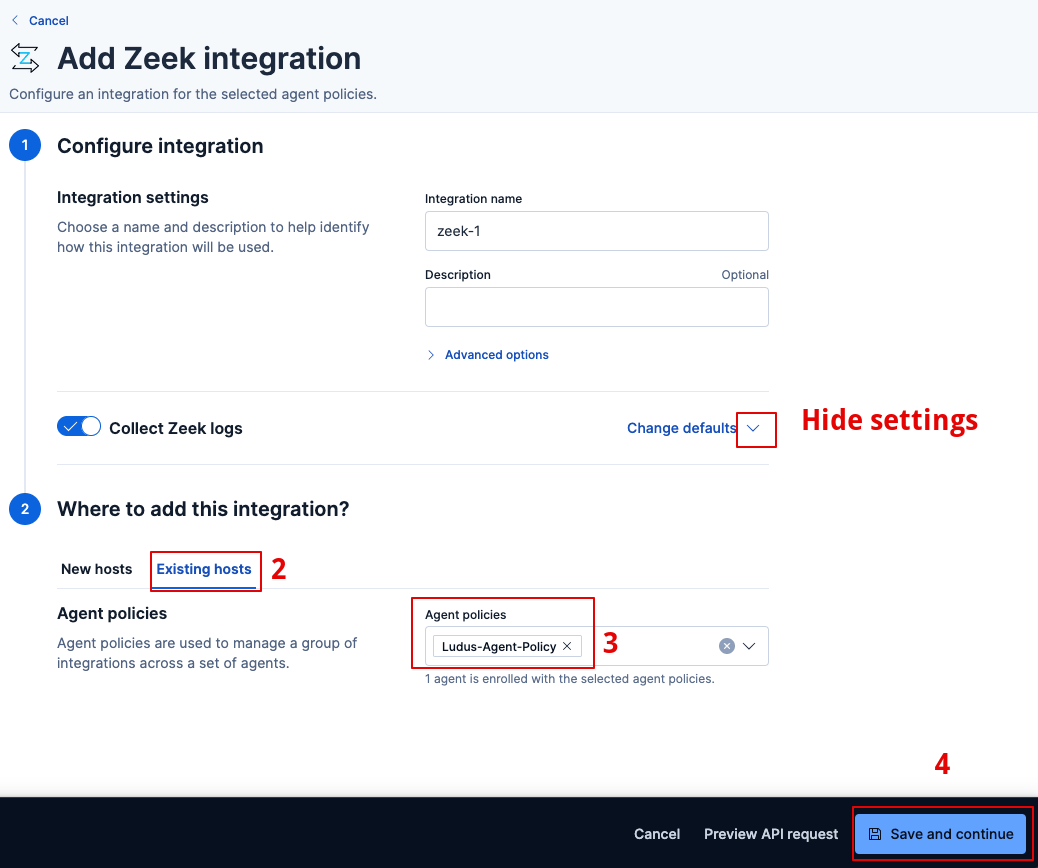
-
Save and Continue: Complete the integration setup
Traffic Generation and Testing
Generate Network Traffic
Use the following commands to generate test traffic for monitoring:
# SSH into your Kali machine
ssh kali@<KALI_MACHINE_IP>

# Switch to root user
sudo su

# Install netexec tool
apt update -y
apt install netexec -y

# Generate SMB scanning traffic
netexec smb <NETWORK_RANGE>/24
netexec smb <DOMAIN_CONTROLLER_IP> -M ntdsutil
Verification Commands
# Check Zeek container status
docker ps | grep zeek-monitor

# View Zeek logs
tail -f /opt/zeek/logs/conn.log

# Check JSON format
head -n 1 /opt/zeek/logs/conn.log
Elastic Search Queries
Basic SMB Traffic Analysis
# Simple SMB port-based query
FROM logs*
| WHERE event.module == "zeek" AND destination.port IN (445, 139)
| STATS connection_count = COUNT(*), total_bytes = SUM(network.bytes) BY source.ip, destination.ip
| SORT connection_count DESC
SMB Traffic Detection
# Check for SMB traffic on port 445
FROM logs*
| WHERE event.module == "zeek" AND (destination.port == 445 OR source.port == 445)
| STATS connections = COUNT(*) BY source.ip, destination.ip, data_stream.dataset
| SORT connections DESC
Lateral Movement Detection
# Detect hosts making SMB connections to multiple destinations
FROM logs*
| WHERE event.module == "zeek"
  AND (destination.port == 445 OR source.port == 445)
  AND @timestamp >= NOW() - 24 hours
| STATS
    unique_destinations = COUNT_DISTINCT(destination.ip),
    total_connections = COUNT(*),
    destination_list = VALUES(destination.ip),
    first_seen = MIN(@timestamp),
    last_seen = MAX(@timestamp)
  BY source.ip
| WHERE unique_destinations >= 3
| EVAL time_span_hours = DATE_DIFF("hour", first_seen, last_seen)
| SORT unique_destinations DESC, total_connections DESC
| LIMIT 20
Architecture
Container Configuration
The role deploys Zeek using the following Docker configuration:
- Image:
zeek/zeek:8.0(configurable vialudus_zeek_version) - Network Mode: Host (for comprehensive packet capture)
- Privileges: Privileged container with NET_ADMIN and NET_RAW capabilities
- Volumes:
/opt/zeek/logs:/logs(log persistence)/opt/zeek/local.zeek:/opt/zeek/share/zeek/site/local.zeek:ro(configuration)
- Interface: Monitors
ens18by default - Restart Policy:
unless-stopped
Log Format
Zeek is configured with JSON logging enabled through the policy/tuning/json-logs.zeek policy, making logs compatible with Elastic Stack ingestion.
Troubleshooting
Common Issues
-
Container not starting: Check Docker service status and container logs
systemctl status docker
docker logs zeek-monitor -
No traffic capture: Verify bridge configuration and interface name
brctl show
ip link show -
Logs not appearing in Elastic: Check Elastic Agent status and integration configuration
systemctl status elastic-agent
Log Locations
- Zeek Logs:
/opt/zeek/logs/ - Docker Logs:
docker logs zeek-monitor - Elastic Agent Logs:
/var/log/elastic-agent/